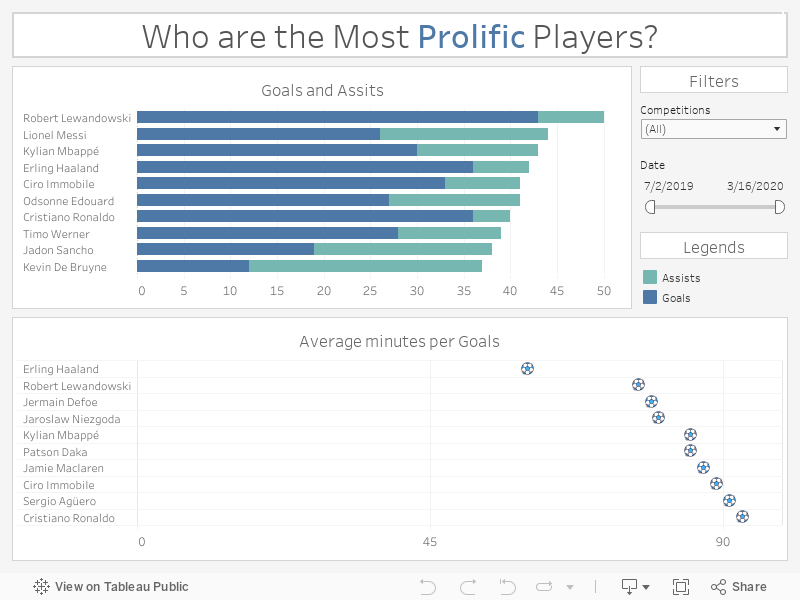
Who are the Most Prolific Players?
24 Mar 2020Today we will speak about one of my favorite hobbies: Football. The purpose of this project is to level up my skills in different fields while I am working on a subject I love. We will start from scratch by collecting our own data and end up by designing a dashboard. The goal is to find the most prolific soccer players on the season 2019-2020. Just bellow, you can find the final result. Underneath the dashboard, We will roll back the process together and discover how we can create this neat interactive visualization.
What I have learned?
- Web Scrapping: After playing around with Beautifull Soup and Selenium, I now have in my toolkits the basic skill of dynamic scrapping
- Data Analysis: I have increased my skills in processing messy data into a structured and clean form. I also gain insight and create new interesting features to improve the visualization
- Data Visualisation: I discover Tableau public and all the cool features of this software.
- UNIX command: I expanded my skill in the shell while I was creating the automation of the program
In this article, I will share with you my experience on this first project. Nevertheless, we will not go too much in code detailed so if you are interested and want to go deeper, you can find all the files of this project on my GitHub page, just right here.
- Get the data
- Clean and prepared the database
- Design the visualisation
- Leave the loop
1. Get the data
Welcome guys in the most important part of the project: collecting the data. We need to be careful regarding the source of our data. We can create the most insightful visualization but if we are using crapy data we can not output a valuable product. Data are the fuel of our car, without it, we can’t go anywhere! Even if we have the last Lamborghini, or if we are Lewis Hamilton’s brother.
How to collect data?
We have multiple choices! First of all, we can find an existing database. It is the easiest way, all the work is done for us. We just need to download the files! However they are sometime hard to find or we often need to pay for it. If we can’t find any suitable database, or if we are broke, we need to create one by ourselves. That means, we have to gather the data from the web by an API, or by Web Scraping. API is often easier to use but not all the web site have one. In my case, I decided to collect the data by Web Scraping. I think it is a good starting point to understand web pages syntaxes when you are a beginner.
What I have done?
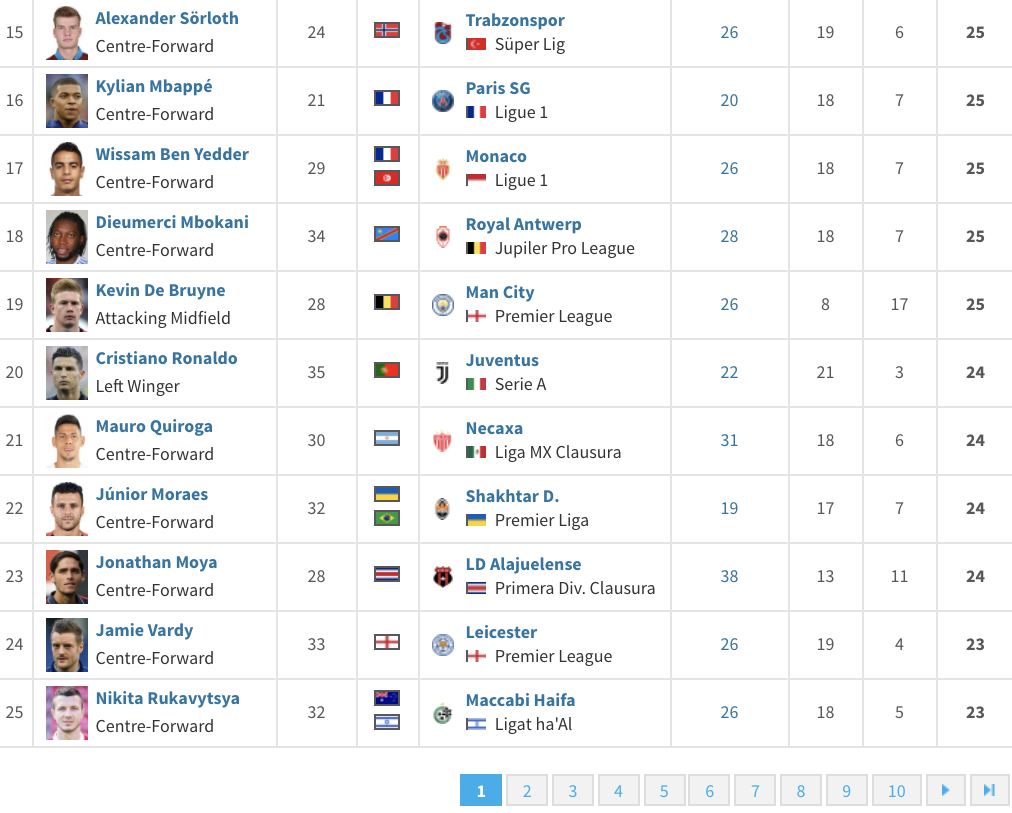
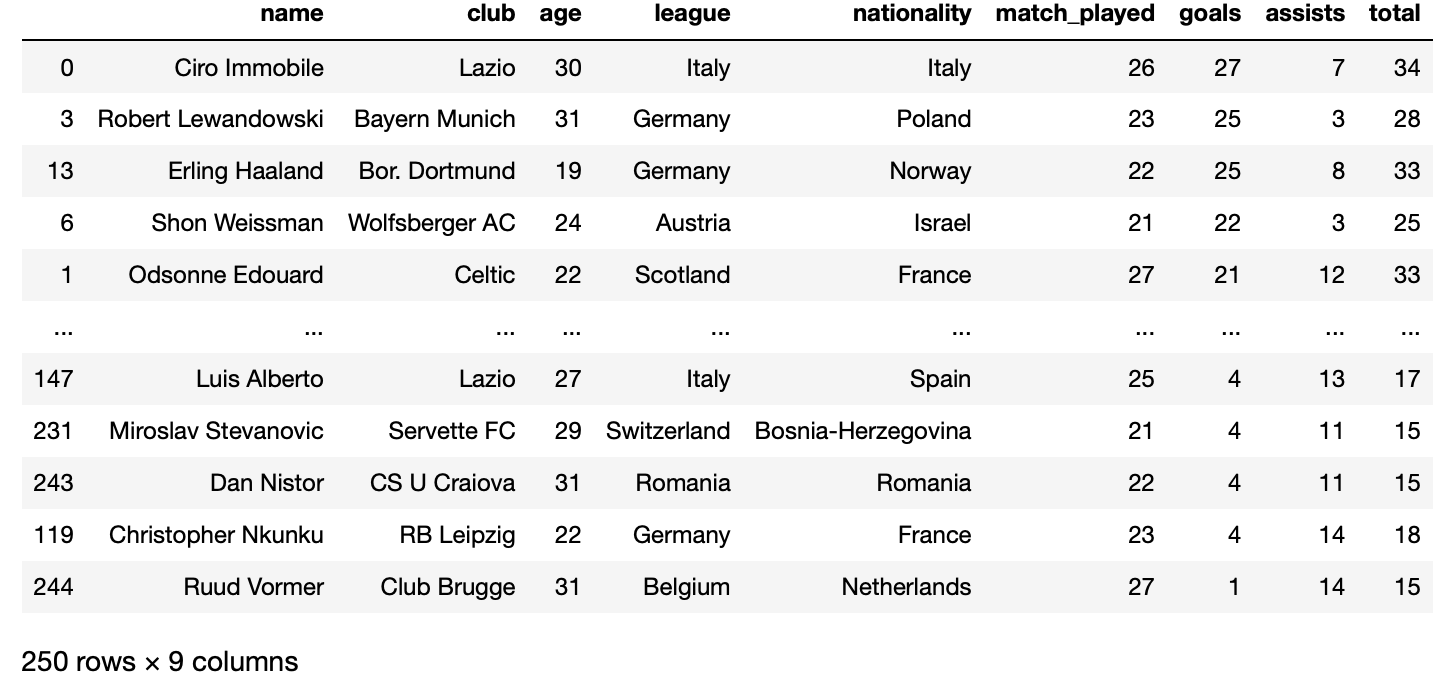
I start my project by gathering the 250 players with the best total of goals and assists on the season 2019-2020. I decided to choose the website Transfermarkt. It is one of the largest and reliable sports websites. In figure 1, we can see the first website page, 25 players with the best totals. After a while, I find out how to handle dynamic Web Scraping by creating a bot who automatically browses and scrape data through the 10 pages of the website. I finally get the table which stores the 250 players with the best total, see figure 2.
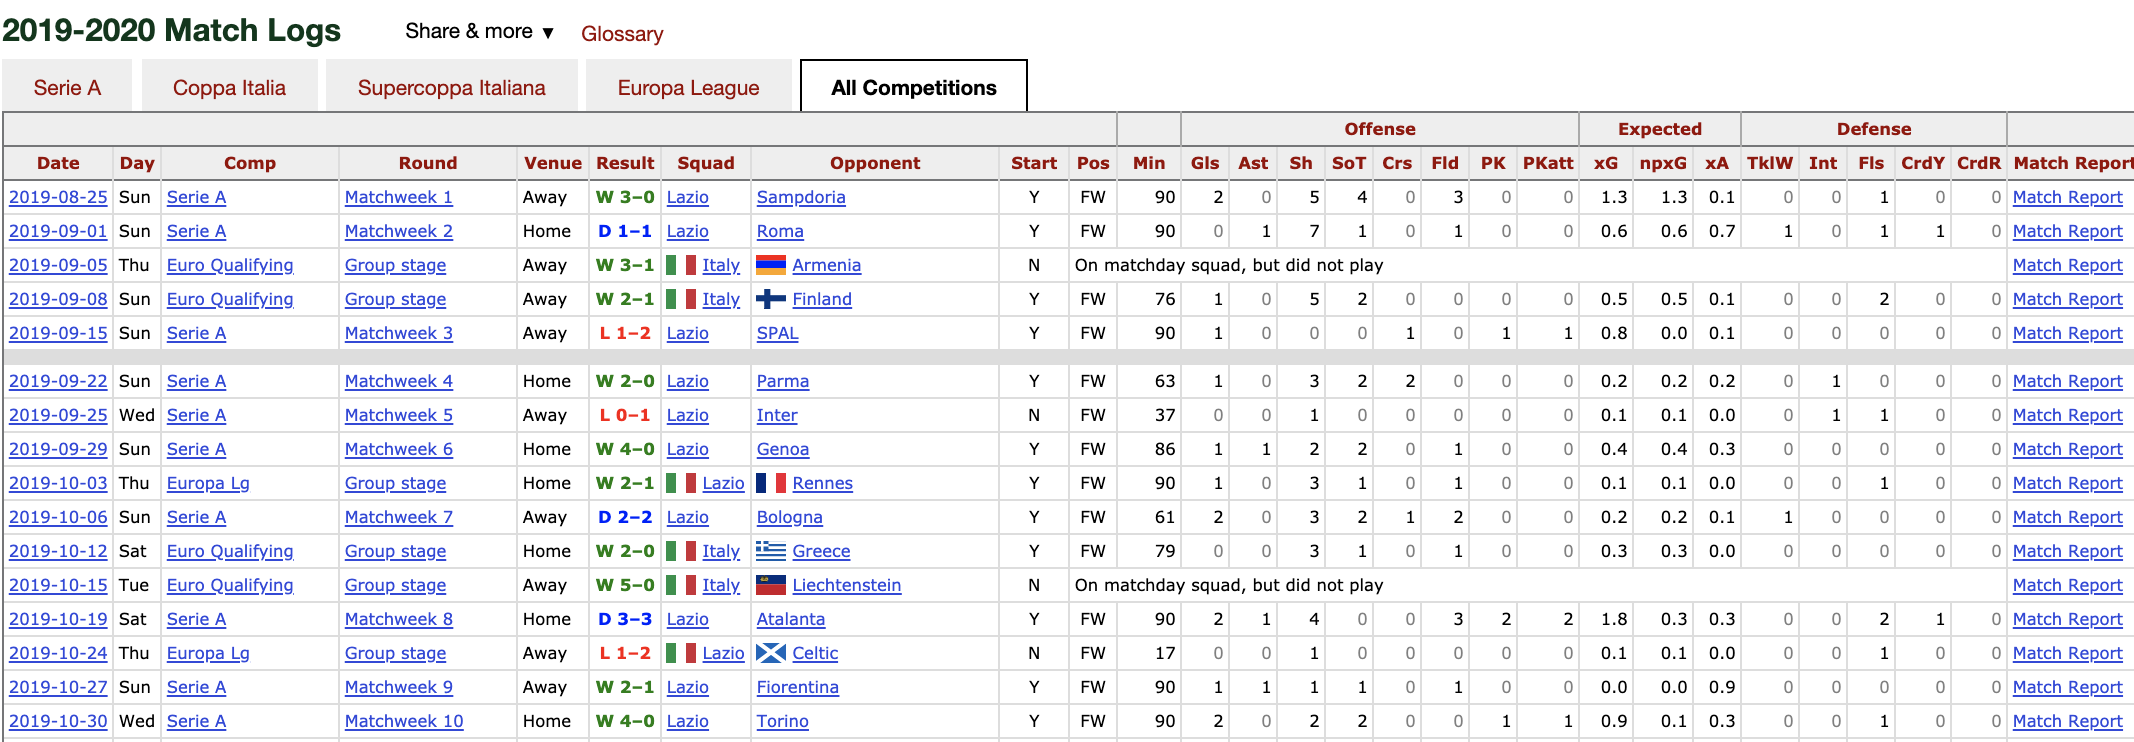
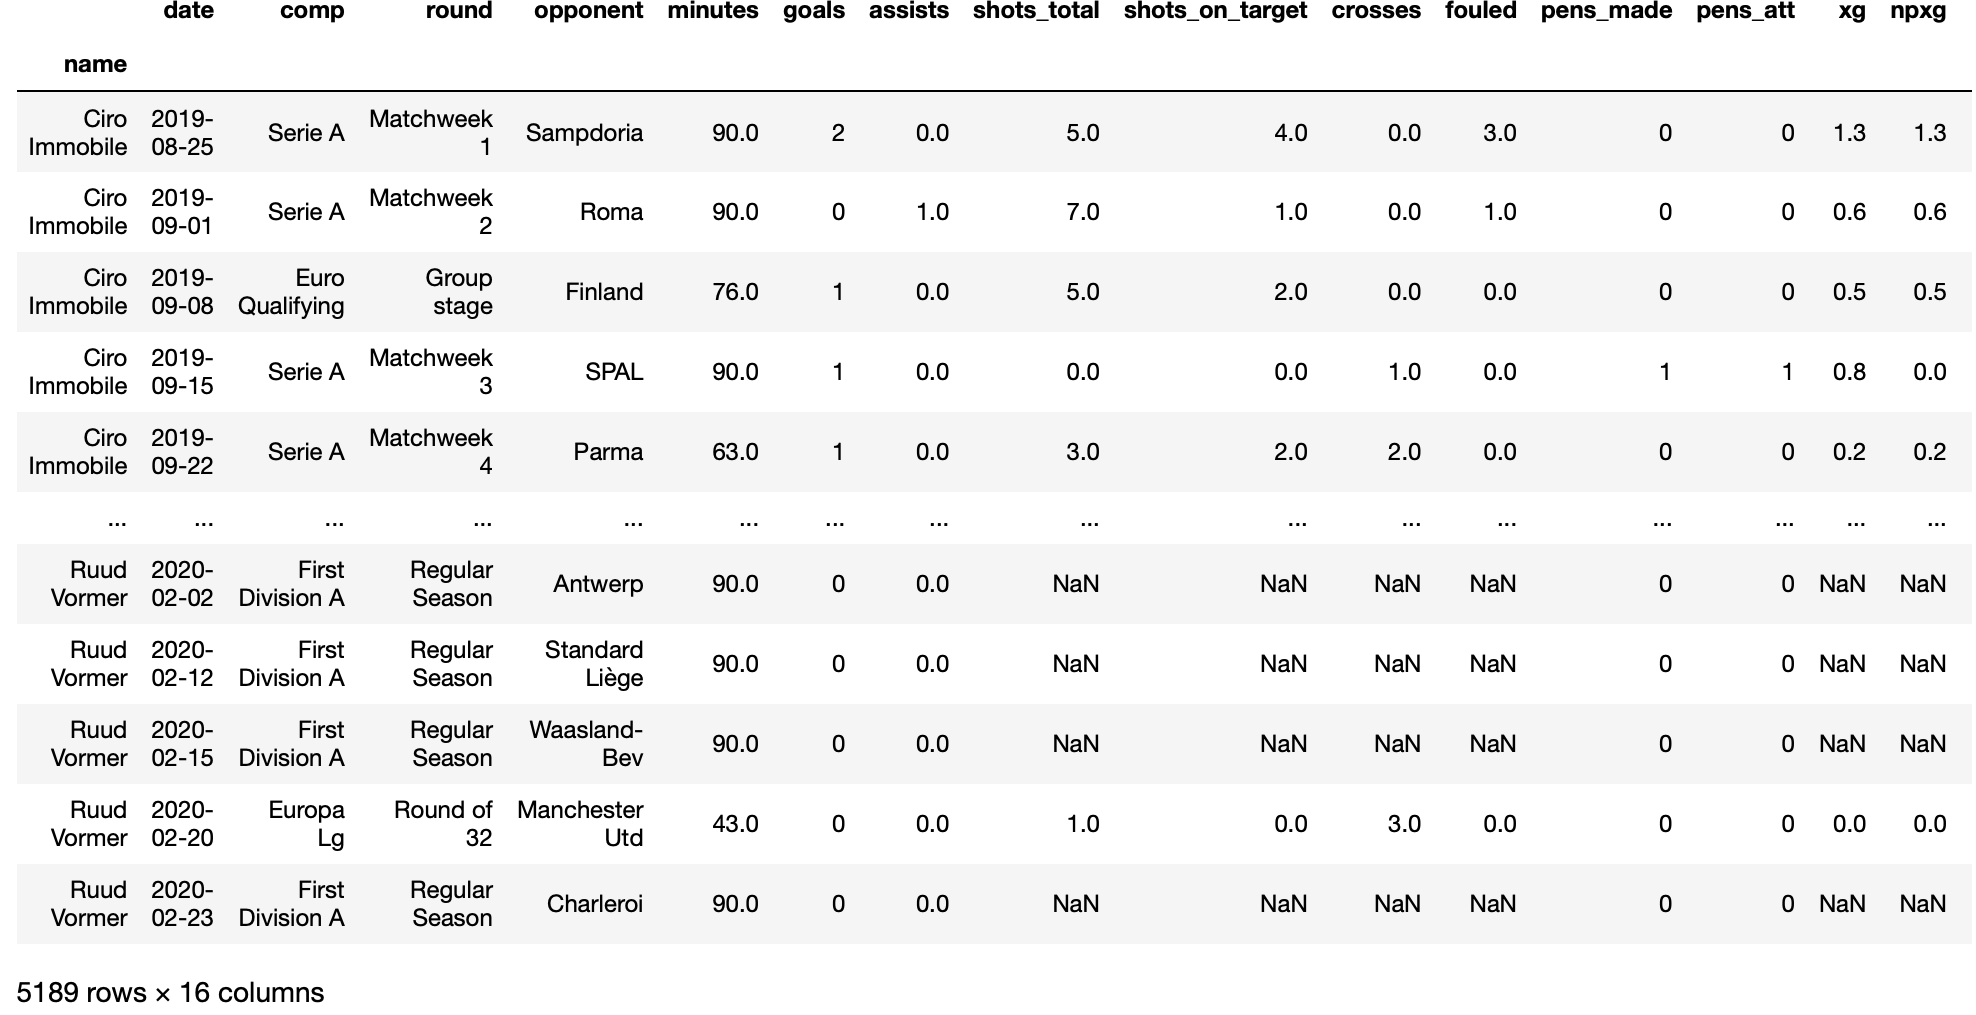
However, the data I have collected so far are global information for each player. In this second part, we will see how we have collected, detailed results on player. For that, we scrape towards the site Fbref, which contains more detailed data. On this website, we can find as expected goals, minutes played, penalties attempts and so on for each game during the season. For instance, in figure 3, we can see the detailed data of Ciro Immobile during the season 2019-2020. In this case, the scrapping process is more complicated than the first one. To understand why let’s quickly compare the two bots. The first one just needs to browse through the 10 pages of the site to collect the 250 best players’ info while the second has to search each player personal page, find into it the table with the detailed result on the actual season and collect the data. That process needs to be done for the 250 players, the main problem is that the player’s page is not similar. To be honest, That was the trickiest part and I was close to bang my head into a wall. However, after a while, I finally found out how to handle the scraping process for each player. We can see the result in figure 4.
To sum up, we create our own database with python web scraping libraries to have access to detailed results on the 250 most prolific players of the world. Now, we need to clean and prepared data before visualization - part 2. Then we will explore different visualization on Tableau - part 3. And finally, we need to leave the loop by automating the update of the database - part 4. Bellow, I share with you some interesting resource on Web Scrapping:
- An adventure in simple web automation, a good first lecture to understand how web automation works on python
- Automate TINDER with Python tutorial, a tutorial video which go through all the process to create a bot
- An introduction to dynamique Web Scrapping with Selenium and Beautiful Soup
2. Clean and prepared the database
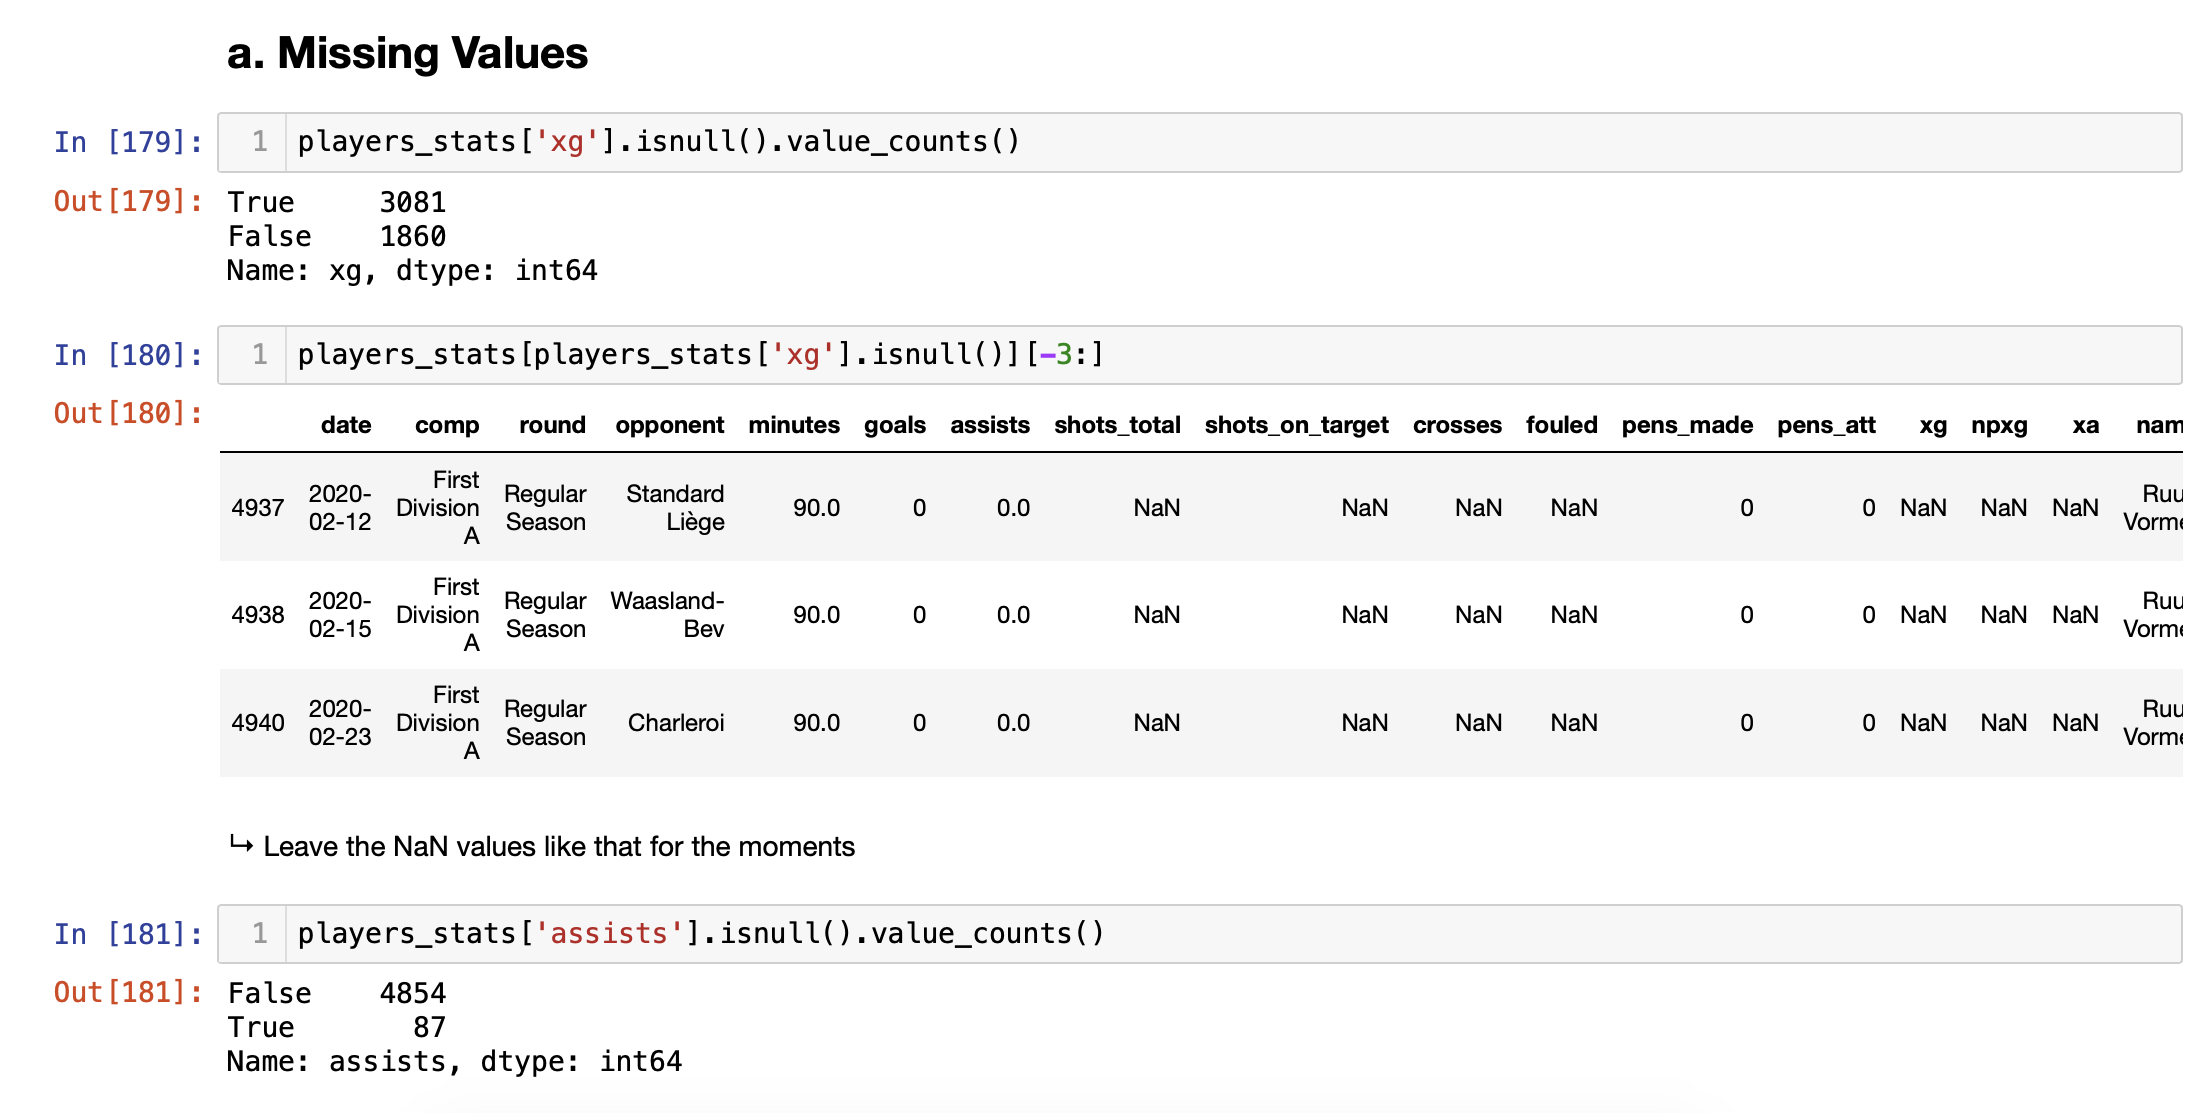
The goal of this part is to clean and prepare the data before visualization. Here we will use python data analysis library, called pandas, which provides an effective solution to perform data preparation. I mean loading, cleaning, transforming, and rearranging the data. Data preparation might be an annoying task and it is often time-consuming. Therefore, the active and wide community in stack overflow of pandas is a must-have when you begin in data science and you get often stuck. In our case, we proceed with basic tasks such as handling missing data or converting data type. For more detailed take a look at the Jupyter notebook on the GitHub page, detailed_stats/analysis.ipynb, I tried to write annotations during the process.
By now we have a clean and basic data frame and we can start exploring the data. I enjoy this part, we start understanding what happened and I feel like Sherlock Holmes. This part is often called data exploration, we will create visualization for the purpose to gain insights that will sharpen our expectations on our final product. Then when we have a more precise idea of what we want, we can go back to our analysis on python and complete it with new features and so on until we are satisfied with our result.
What I have done?
In my case, I make the choice to group the game during the season in four buckets: domestic league, Champion league, Europa League and Cup. Thus, it is possible to filter the players by game categories. I also create two new features that describe how a player is effective. These attributes describe the average time in minutes for a player to score and to give an assist.
For example, in his domestic league, Erling Haaland scored 25 times but he scored on average every 60 minutes. On the other hand, Ciro Immobile scored 27 goals in his domestic league but he had an average time per goal higher of 79 minutes. That means Haaland is a more effective player even if he scored less.
Finally, we have a decent input for our final visualization! Do not forget this is an iterative process between preparation and visualization. I do not create this analysis in one shot, I create a basic simple analysis. Then, I was growing insight into Tableau by exploring the data. Thus, I was able to have a clear idea of what I want for my Dashboard. I transform that idea into new features by going back on my Jupyter Notebook and so on until I was satisfied with my Dashboard. In the next part, we will see why we bother to handle the visualization part on Tableau instead of simply using python visualization libraries. To go deeper into analysis with python, I recommend the book of Wes McKinney, a superb resource to get started with pandas and the other data science libraries!
3. Design the visualisation
Python libraries as matplotlib, seaborn, plotly, and others are very functional and capable of almost any visualization. On the other hand, Tableau is quite easy to use, with a large panel of tools, and gives us wonderful visualization. Moreover, Tableau’s built-in instruments speed the process of complex visualization. For instance, it is effortless to create a map plot or use interactive filters. Tableau is a strong tool when we want to present our results to a client or when the visualization is really important. However, it could be annoying to juggling between Tableau for data visualization and Python. Therefore, if we just create basic visualization for gaining insight from the data we are good with Python. In some cases, when we need extra customization, we can also hit the limit of Tableau in this case we have to use Python as well.
What I have done?
In my case, I keep the dashboard simple, with two plots. The one on the top relates the number of goals and assists of the ten best players. The bottom one, “Average time per Goals”, display the ten most effective scorer, I mean players with the best ratio of goals by minutes played. The Dashboard are interactive with two filters. The first one, give the possibility to play on a range of date and the other to pick the competition type - domestic league, cup, and European cup. I add some additional information in the tooltip of each plot as well.
To conclude this part, our beautiful visualization can already be used. However, in some cases such as mine, we will often need to refresh the data. In the next part, we will see how to automate this process and get out of the loop. Bellow some good resource I found regarding Tableau:
- Tutorial from Tableau public, learn the basics with Tableau itself
- 10 Tableau Dashboard Design Tips, a youtube video to create a clean Dashboard
- Tips and Tricks from a Tableau Jedi, a youtube video with some useful tips
4. Get out of the loop
By now, we scraped the web to create a detailed database of the most prolific players. Then we have cleaned and explored the data for the purpose to create a dashboard on Tableau. By now, we can share on our website our dashboard and start using it like a tool to compare the different players. Nevertheless, if the data are not updated every week dashboard will become useless and non-accurate. As each team plays on average one game per week, players statistics’ will grow every week and the dashboard will be up to date. If we don’t need to update our data as often, we can manually update it. However, this boring task can be updated and we can make better use of our time!
Automate the boring stuff
As already discuss, our data need to be updated every week. To leave the loop, we will create a background process which run every Monday at 12:30 PM our programs. I will explained how I handle it on my a MAC computer, it might be different on a different operating system. To do it I used a tool call launchd, a tool for starting, stopping and managing scripts and processes. First you need to defined the task to proceed in background on a XML code. You will give a name to our job, specify the task you need to automate, and define a schedule. This XML code are stored as a .plist in ~/Library/LaunchdAgents.
    <?xml version="1.0" encoding="UTF-8"?>
    <!DOCTYPE plist PUBLIC "-//Apple//DTD PLIST 1.0//EN" "http://www.apple.com/DTDs/PropertyList-1.0.dtd">
    <plist version="1.0">
    <dict>
    		<!--script name-->
        <key>Label</key>
        <string>soccer.analysis</string>

    		<!--script job-->
        <key>ProgramArguments</key>
        <array>
            <string>/Users/axel/opt/anaconda3/bin/python</string> <!--python path-->
            <string>file/path</string> <!--python file path-->
        </array>

       <!--run every 3 hours-->
    	<key>StartCalendarInterval</key>
    	<dict>
    		<key>Weekday</key>
    		<integer>0</integer>
    		<key>Hour</key>
    		<integer>12</integer>
    		<key>Minutes</key>
    		<integer>30</integer>
    	</dict>

        <!--collect errors & output-->
        <key>StandardOutPath</key>
        <string>/tmp/collect.data.covid974.out</string>
        <key>StandardErrorPath</key>
        <string>/tmp/collect.data.covid974.err</string>
    </dict>
    </plist>
Next from the shell we need to load our scripts.
    cd ~/Library/LaunchAgents
    launchdctl load soccer.analysis
And that all our script will run our python in background every morning a 12:30 pm 🥳
To have better explanation on this topic you might want take a look at this posts:
- Launchd documentation, complete and well explain
- How to Use launchd to Run Scripts on Schedule in macOS, detailed explanation of the process
Conclusion
I realised how is it important to work on personal project to level up and sharpen my skills. Moreover, as long as we clearly define what we want to do grammatical language programming are easy to find online - when the community is wide. That why from my perspective, the most important skills are for me computer thinking, and problems solving.